Stata: Repeated Measures ANOVA
16 Nov 2010Analyzing Repeated Measures
The example for this post comes from Warner, R.M. (2008) Applied Statistics: From Bivariate to Multivariate Techniques. Thousand Oaks, CA: Sage – Chapter 20. The example data come from an experiment in which a researcher examines the effects of four stress conditions on heart rate on N=24 subjects. The four stress conditions are:
- Baseline
- Pain Induction
- Mental Arithmetic
- Social Role Play
We will consider 2 ways to analyze this data.
- Using the built-in command
anova. - Using the user-written command
wsanova.
But first let’s look at the structure of the data. The data are in “long” format (i.e., there are multiple lines of data for every person). The anova and wsanova commands expect the data to be in long format.
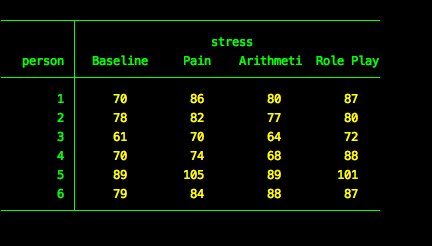
We can also create a table of the data using the tabdisp command.
tabdisp person stress, cellvar(hr) center cellwidth(9)

This shows us each person’s score in all conditions.
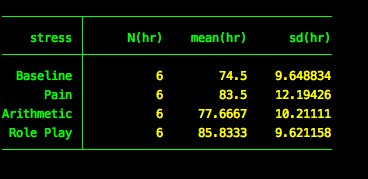
You can also use the table command to specify any other data you want to look at.
table stress, contents(n hr mean hr sd hr)

This shows us the observations, mean and standard deviation for each condition.
Method 1: anova
To specify a repeated measures anova using the anova command, we’ll use the repeated option. I’ve found the repeated option to be a bit confusing sometimes, because I initially thought the repeated option meant the variable for which there are multiple measures – namely, person in our example. Instead, the repeated option expects the factor on which persons were repeatedly observed. In our case, this is stress. Thus, the syntax is:
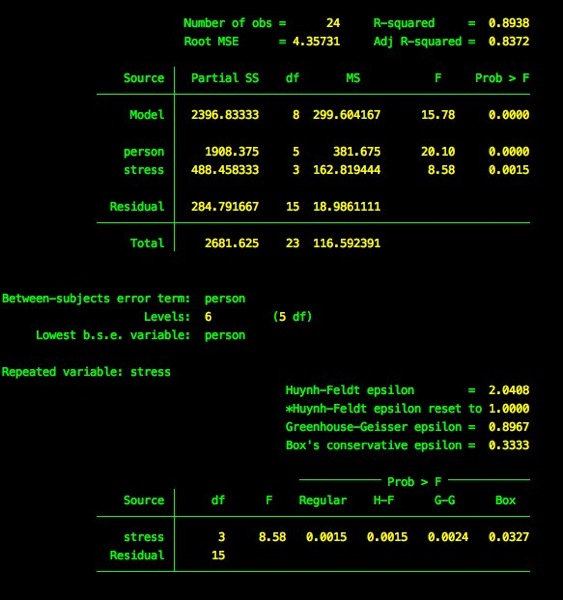
anova hr person stress, repeated(stress)

The output at the bottom provides the corrected p-values for each of the three epsilons.
Method 2: wsanova
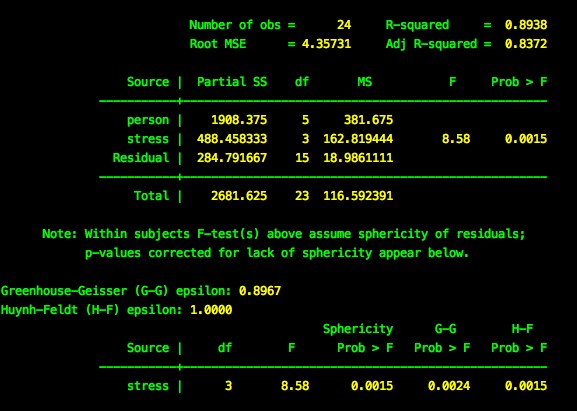
A second method for estimating a repeated measures anova is to use the user-written command wsanova (type findit wsanova and install after clicking “sg103”). The syntax is different and I believe it is a bit more intuitive because we specify the variable that identifies the subjects we repeatedly observe using the id option. To get the corrected p-values, we also need to specify the epsilon option.
wsanova hr stress, id(person) epsilon
