Stata: Bivariate Regression
19 Apr 2011Bivariate Regression
In this post we’ll use the system dataset auto.
sysuse auto, clear
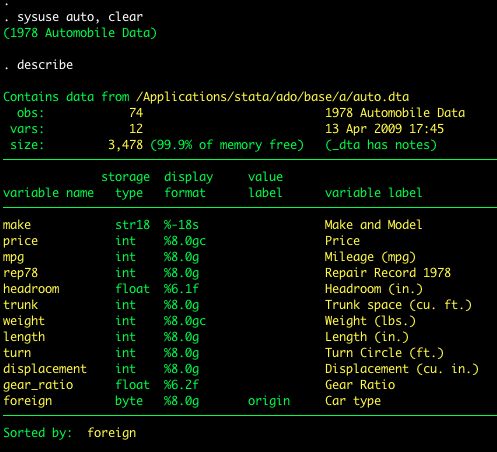
To estimate the model we use the regress command in the command window. The regress command follows the general format of regress dv iv, options. Type help regress or visit the online help for regress for a description of the options available for regress. For example the regression of price on mpg is estimated as follows:
regress price mpg
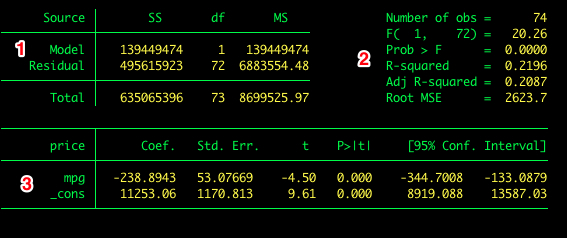
The output includes:
- The ANOVA source table
- Descriptive statistics and effect sizes
- Coefficients, hypothesis tests, and confidence intervals
Standardized Coefficients
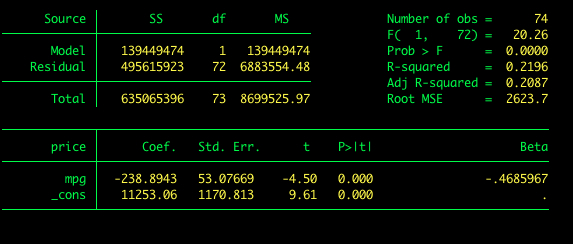
Suppose we would like Stata to report standardized coefficients. To get standardized coefficients we add the beta option to our command.
regress price mpg, beta
Visualizing Regression Lines
We can visualize the relationship between two variables with a scatterplot. Stata’s graphics provide several useful commands for including regression lines on a scatterplot. We’ll discuss the lfit and lfitci commands.
To produce a scatterplot between price (y-axis) and mpg (x-axis), we use the graph twoway scatter command.
graph twoway scatter price mpg
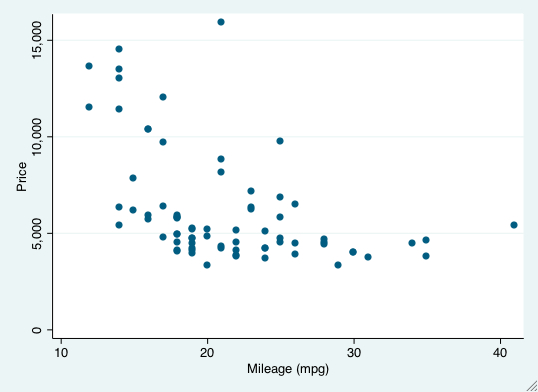
Now let’s add the regression line to the plot. The lfit graph command allows us to do this (lfit stands for linear fit). However, we don’t want the regression line in isolation. We want it on top of the scatterplot. Stata lets you combine twoway graphs in one of two ways: (1) using parentheses or (2) using pipes. To add the regression line with parentheses, we type:</p>
graph twoway (lfit price mpg) (scatter price mpg)
The first set of parentheses is the regression line and the second is the scatterplot. This produces the following plot:
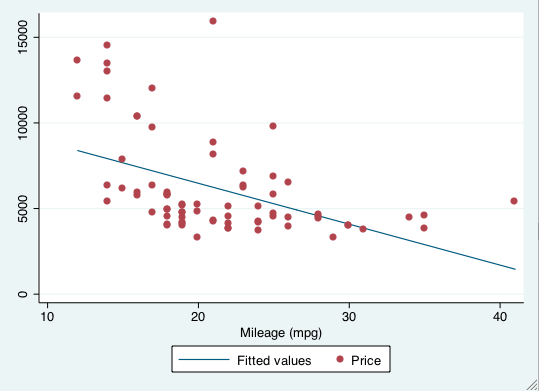
To add the regression line with pipes (this produces an identical plot as above), we type:
graph twoway lfit price mpg || scatter price mpg
It can be nice to include confidence intervals on the plot. To do this we simply change the lfit command to lfitci, where the ci refers to confidence interval.
graph twoway lfitci price mpg || scatter price mpg
