Stata: Correlation and Covariance
21 Apr 2011Correlation and Covariance
This post will illustrate how to:
- Create a correlation matrix of variables using the
correlatecommand. - Display a correlation matrix as a covariance matrix.
- Obtain the statistical significance of a correlation using the
pwcorrcommand.
Correlation Matrix
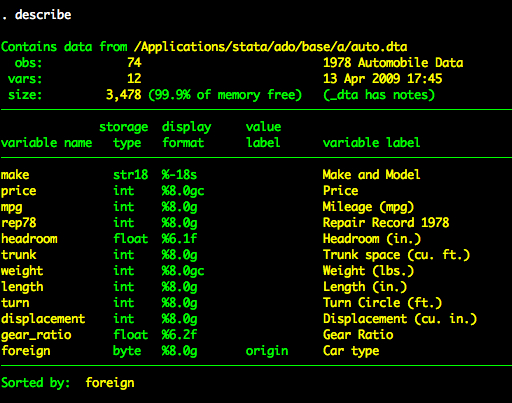
We’ll use the auto dataset for this tutorial.
sysuse auto, clear

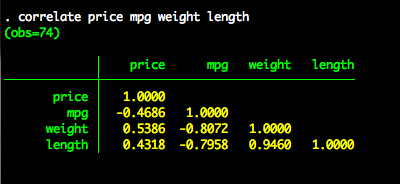
We’ll create a correlation matrix of four variables – price, mpg, weight, and length.
correlation price mpg weight length

Note: We can shorten the correlation command to corr for convenience.
Covariance Matrix
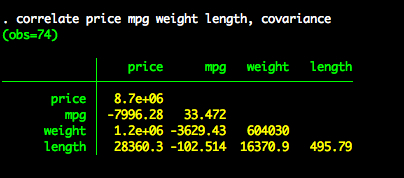
If we want to create of covariance matrix, we simply add the covariance option to the correlation command.
correlation price mpg weigh length, covariance

Statistical Significance of a Correlation
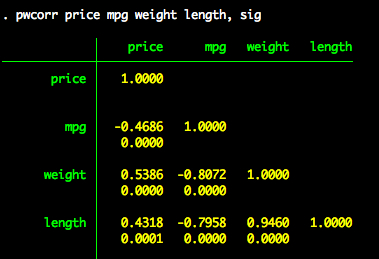
The correlation command produces a clean correlation matrix (or covariance matrix with the covariance option). If we want to see the statistical significance of a correlation, we need to use the pwcorr command with the sig option.
pwcorr price mpg weight length, sig
