29 May 2011
Problem Description
The prime factors of 13195 are 5, 7, 13 and 29. What is the largest prime factor of the number 600851475143?
Python Solution
I started trying to solve this problem by writing a function for identifying prime numbers. I found an entry on Wikipedia for the “Sieve of Eratosthenes.” The entry also included Python code for implementing the sieve. I’ve reproduced an adapted version of the Wikipedia code. I had to change it because my computer ran out of memory when creating the candidate list. I had to change it so the candidate list had an upper limit of the square root of 600851475143. In any case, here is the solution with the sieve function first and then a function for actually solving the problem.
def sieve(n):
    fin = int(n**0.5) ##candidates below sqrt of n -- this is the upper limit
    candidates = list(range(fin+1)) ##This is an change of the wiki code

    # Loop over the candidates, marking out each multiple.
    for i in xrange(2, fin+1):
        if candidates[i]:
            candidates[2*i::i] = [None] * (fin//i - 1)
            ##the previous line replaces all multiples of i with None

    # Filter out non-primes and return the list.
    return [i for i in candidates[2:] if i]
##A function for returning prime factors of n
def largeprime(n):
for i in sieve(n):
if n % i == 0:
yield i
##Return the prime factors as a list and print the last number
div = list(largeprime(n))
print div[-1]
This solution takes .38 seconds.
25 May 2011
Problem Description
Each new term in the Fibonacci sequence is generated by adding the previous two terms. By starting with 1 and 2, the first 10 terms will be:
1, 2, 3, 5, 8, 13, 21, 34, 55, 89, …
By considering the terms in the Fibonacci sequence whose values do not exceed four million, find the sum of the even-valued terms.
Python Solution 1
This solution creates a function fibon that takes a single argument – maximum. The value of maximum will be 4,000,000 in this example. The function first initializes an iterator (i), a list with two entries (fib), and a variable (n) that will be used to tell Python when to stop the while loop. The while loop creates the next entry in the sequence (fibtemp), makes it a list, and adds it to the fib list. Then it alters the value of n and adds 1 to the iterator.
Next it creates another empty list to hold the even numbers of the sequence (fibeven). The it uses a for loop over the elements of fib to identify whether a particular element is even. If it is even, it adds that element to fibeven. The function then returns the sum of fibeven.
def fibon(maximum):
    i = 2
    fib = [1,2,]
    n=0
    while n < maximum:
        fibtemp=fib[i-2]+fib[i-1]
        fibtemp = [fibtemp]
        fib.extend(fibtemp)
        n = fib[i]
        i = i + 1
    fibeven = []
    for j in fib:
        if j % 2 == 0:
            j = [j]
            fibeven.extend(j)
    return sum(fibeven)

print fibon(4000000)
Python Solution 2
This solution uses a generator function to create the sequence. You can tell it is a generator function because of the yield keyword in it. Then I used NumPy arrays to process the sequence and identify the even numbers. I’ve been using NumPy quite a bit lately, so I wanted to come up with a solution that involved NumPy.
import numpy as np

def fibfun(maxnum):
    x = 0
    y = 1
    while x < maxnum:
        yield x
        x,y = y, x+y

allnum = list(fibfun(4000000))
npall = np.array(allnum)
npeven = npall[np.where(npall % 2 == 0)]
print np.sum(npeven)
24 May 2011
Problem Description
If we list all the natural numbers below 10 that are multiples of 3 or 5, we get 3, 5, 6 and 9. The sum of these multiples is 23. Find the sum of all the multiples of 3 or 5 below 1000.
Python Solution #1
This uses the built in range() function to get all multiples of three and five. The problem with this solution is that there is going to be overlap between the values in three and five lists. Consequently, we have to put them in a common list (using extend()) and identify the unique values with the set() function. I also sorted them because I like it better that way.
answer =[] # empty list
three = range(0,1000,3) #list of multiples of 3
five = range(0,1000,5) #list of multiples of 5
answer.extend(three) # add three to the answer list
answer.extend(five) #add five to the answer list
answer.sort() #sort the list
print sum(set(answer)) #print the sum of the unique values
Python Solution #2
This solution uses a for loop and take advantage of the mod operator in python – % – to identify values between 0 and 1000 that are divisible by 3 or 5 (i.e., have a mod equal to 0).
answer2 = [] #empty list
for i in range(1000): #iterate from 0 to 999 -- 1000 isn't included
	if i % 3 == 0 or i % 5 == 0: #identify whether i is divisible by 3 or 5
    	answer2.append(i) #if divisible, then append it to the answer2 list
print sum(answer2) #print the sum of answer 2
This will produce the correct answer. It is a bit slower than Solution #1 but both are very fast.
26 Apr 2011
Stata’s Interface
Part 1
Part 2
23 Apr 2011
Scatterplots and Histograms
In this post I’ll show you how to:
- Create a basic scatterplot for examining the relationship between two variables.
- Add a lowess smoother to a scatterplot to help visualize the relationship between two variables.
- Create a histogram to look at your data.
Basic Scatterplots
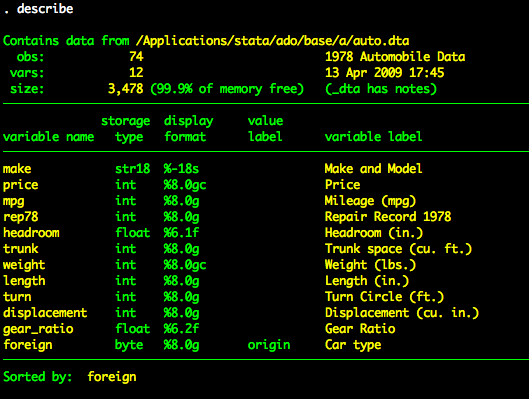
In this post we’ll use the auto dataset.
Creating a Scatterplot
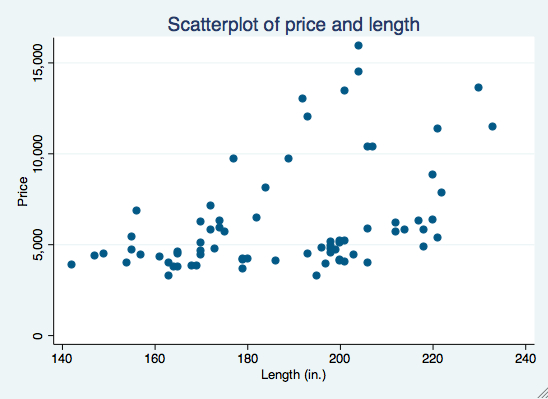
Creating scatterplots is easy in Stata. We’ll use the graph twoway scatter command (we can just type scatter but I like to use the graph twoway syntax to make things more consistent across graph types. We’ll visualize the relationship between price and length. When using graph twoway scatter we first list the variable that we want on the y-axis and then the variable we want on the x-axis. We’ll also add a title to the graph.
graph twoway scatter price length, title("Scatterplot of price and length")
Adding a Lowess Smoother
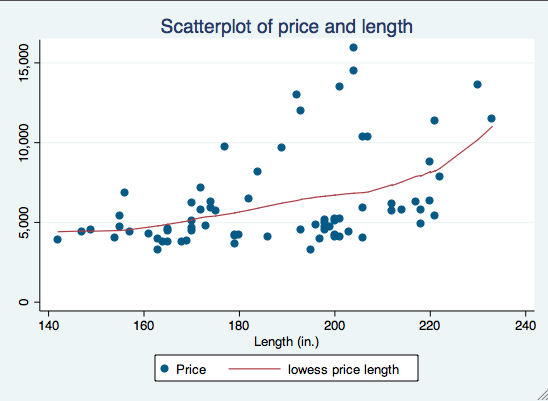
Adding the lowess smoother is easy as well. To do this we are going to append two graph twoway plots. Specifically, we are going to append scatter and lowess. We append two plots by using double-pipes – ||. The pipe is found on the key directly above return or enter on most keyboards (you need to hold shift).
So to get the scatterplot of price and length with a lowess smoother, we type:
graph twoway scatter price length || lowess price length, title("Scatterplot of price and length")
Histograms
You can also use a histogram to look at your data. To create a histogram using drop-down menus, you will go to Graphics -> Histogram. In this dialogue box you need to specify which variable you are looking at in the “Variable” box. You can make any other changes or specifications you need within this window. For example, if I wanted to create a histogram of price, with the y-axis reflecting frequency, I would enter “price” in the “Variable” box and click on the “Frequency” option under the Y axis.
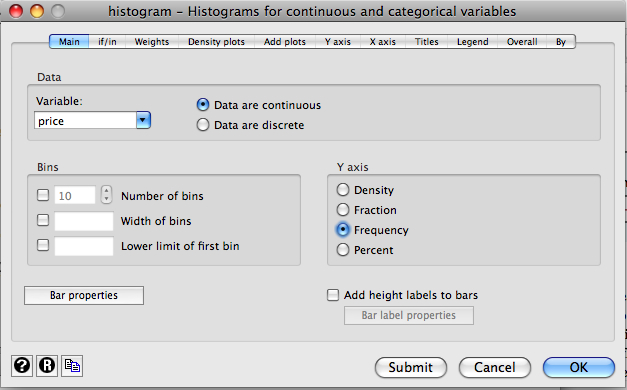
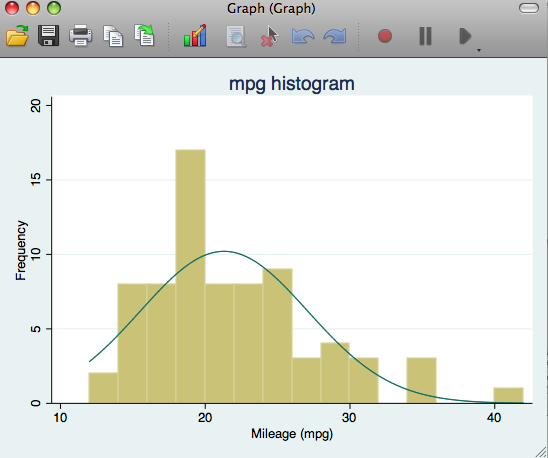
To create a histogram using commands, just type “histogram (your variable).” For example, to look at miles per gallon, you would type:

Often the default settings of the histogram may not be the best representation of your data. There are a number of useful options with the histogram command, including width with allows you to specify bin width, frequency which changes the y-axis to reflect frequency instead of density and normal which overlays a normal curve onto your graphic. You can also modify the title and axes of the graph using syntax options.
histogram mpg, width(2) frequency normal title(mpg histogram)
